Effect of calcified seaweed supplementation on white shrimp (Litopenaeus vannamei) at low salinity condition on growth performance, digestibility, immunity, and accumulation of calcium and magnesium
Objective
The trial was conducted to evaluate the benefits of calcified seaweed (LithoNutri Acqua® and LithoNutri micron®) in white shrimp feed formula on performance, digestibility, intestinal histology, immunity, and accumulation of calcium and magnesium.
Study design
Experimental study was focusing on 1) two particle size of calcified seaweed, LithoNutri Acqua, powder product, 75% passthrough in 300μm (50 mesh) and 25% passthrough in 44μm (325 mesh) and LithoNutri micron, powder product, 100% pass through the 44 µm mesh sieve (325 mesh). Both products contain Ca > 32% and Mg > 3% then 3 levels of calcified seaweed was supplemented in the feed at 0, 2 and 5 Kg/MT. The study was assigned in Factorial in Completely Randomized Design 2*3 (factorial 2*3in CRD) with 6 treatments and 6 replicates as following:
- Group 1 Basal feed : LithoNutri Acqua 0 kg/ton
- Group 2 Basal feed : added LithoNutri Acqua 2 kg/ton
- Group 3 Basal feed : added LithoNutri Acqua 5 kg/ton
- Group 4 Basal feed : added LithoNutri micron 0 kg/ton
- Group 5 Basal feed : added LithoNutri micron 2 kg/ton
- Group 6 Basal feed : added LithoNutri micron 5 kg/ton
Study place
Faculty of Fisheries, Kasetsart University.
Experimental animals
White shrimp weight average 2 g. from a private farm, Samutsongkarm province, Thailand. Shrimp was acclimated in 1,000L fiber tanks for 7-10 days and fed control feed, 3 times a day and then graded the same size to stock in experimental unit.
Experimental condition
The experiment was carried out in 30 tanks with each of 500 L capacity, 250 L of 5 ppt saline water (modified sea water). White shrimp with initial weight of 2 g was stocked at a density of 30 shrimp/tank (100 individual/ m3). The diet was applied to shrimp 3 times a day at 2-3% of body weight. The water and feed waste in the tank was siphon out 15-20% and then add the new water every two days. all water parameter control in optimum of shrimp culture, DO>5.5 mg/L, pH 7.5-8.0, alkalinity>80mg/L, ammonia <0.5 mgNH3-N/L. The trial period was 8 weeks.
Experimental diets
Shrimp feed was preparing from one feed formula of 38%CP and 6.5% lipid then supplemental the calcified seaweed. Feed materials were ground to 150-250 micron, mixed together, and then add water by 25% before passing through Hobart mincer to form pellet and dry by hot air oven at 80 oC for 8 Hr. After cooled down the pellet was kept in plastic bag at room temperature until used.
Table 1 Experimental diet composition
|
Material (%) |
T1-Control |
T2-LNA2 |
T3-LNA5 |
T4-Control |
T5-LNM2 |
T6-LNM5 |
| Fishmeal,tuna | 7.0 | 7.0 | 7.0 | 7.0 | 7.0 | 7.0 |
| Soybean meal | 35.0 | 35.0 | 35.0 | 35.0 | 35.0 | 35.0 |
| Squid meal | 2.0 | 2.0 | 2.0 | 2.0 | 2.0 | 2.0 |
| Poultry meal by product | 7.0 | 7.0 | 7.0 | 7.0 | 7.0 | 7.0 |
| Wheat flour | 27.0 | 26.8 | 26.5 | 27.0 | 26.8 | 26.5 |
| Wheat gluten | 4.0 | 4.0 | 4.0 | 4.0 | 4.0 | 4.0 |
| Soy protein concentrate | 5.0 | 5.0 | 5.0 | 5.0 | 5.0 | 5.0 |
| Tuna fish oil | 1.0 | 1.0 | 1.0 | 1.0 | 1.0 | 1.0 |
| Soya oil | 1.5 | 1.5 | 1.5 | 1.5 | 1.5 | 1.5 |
| Soy lecithin | 2.0 | 2.0 | 2.0 | 2.0 | 2.0 | 2.0 |
| Mono-calcium phosphate | 2.0 | 2.0 | 2.0 | 2.0 | 2.0 | 2.0 |
| Lime stone/oyster shell | 1.0 | 1.0 | 1.0 | 1.0 | 1.0 | 1.0 |
| LithoNutri Acqua | 0.0 | 0.2 | 0.5 | 0.0 | 0.0 | 0.0 |
| LithoNutri micron | 0.0 | 0.0 | 0.0 | 0.0 | 0.2 | 0.5 |
| Polymethyl carbamide | 0.5 | 0.5 | 0.5 | 0.5 | 0.5 | 0.5 |
| Vitamin premix | 5.0 | 5.0 | 5.0 | 5.0 | 5.0 | 5.0 |
| Sum | 100.0 | 100.0 | 100.0 | 100.0 | 100.0 | 100.0 |
| Proximate composition (AOAC, 2016) | ||||||
| Moisture (%) | 8.18 | 8.55 | 8.28 | 8.18 | 8.26 | 8.14 |
| Protein (%) | 37.26 | 37.56 | 37.49 | 37.26 | 37.17 | 37.18 |
| Lipid(%) | 6.69 | 6.99 | 7.21 | 6.69 | 7.35 | 7.33 |
| Fiber(%) | 1.66 | 1.64 | 1.77 | 1.66 | 1.76 | 1.67 |
| Ash(%) | 16.15 | 16.37 | 16.43 | 16.15 | 16.38 | 16.43 |
| Calcium(%) | 2.02 | 2.10 | 2.15 | 2.02 | 2.11 | 2.18 |
| Phosphorus(%) | 1.40 | 1.44 | 1.47 | 1.40 | 1.42 | 1.45 |
| Energy (Kcal/Kg) | 4,105.18 | 4,007.45 | 4,181.93 | 4,105.18 | 4,140.69 | 4,043.13 |
Note: Calcified seaweed were added follow the designed dose
Measurements and sampling times
The effects of LithoNutri Acqua and LithoNutri micron supplementation was evaluated based on the following criteria:
- Shrimp performance in term of growth (bi-weekly) :
- Final body weight, feed intake, feed conversion ratio, average daily gain, specific growth rate and survival rate were evaluated.
- Shrimp immunity:
- Shrimp immunity in terms of hemocyte count, hemolymph protein, phenol oxidase activity and lysozyme activity.
- Antioxidative stress enzyme activity at day 14 and at the end of feeding trial:
- superoxide dismutase activity and gluthathione peroxidase activity in shrimp hemolymph was evaluated.
- Digestive enzyme activity:
- Shrimp digestive enzyme activity in term of protease, lipase, amylase was determined at the end of trial.
- In vivo digestibility of diets:
- To evaluate the efficacy of calcified seaweed on promoting nutrient digestibility, an in vivo digestibility of treatment diets was conducted by focusing on protein, lipid, calcium and phosphorus digestibility.
- Proximate analysis of shrimp meat:
- Crude protein, crude fat, moisture, and ash in raw shrimp meat was determined at the end of trial.
- Accumulation of calcium and magnesium
- Calcium and magnesium accumulation in raw shrimp meat and shrimp shell was determined at the end of trial by ICP-OES.
- Cooked shrimp color
- At the end of trial, whole shrimp was collected to compare the cooked shrimp color by boiling for 2 min and then cooked shrimp color was determined on the second abdominal shell using samofan and colorimeter.
- Histological of hepatopancreas and intestine was collected at the end of
Statistical analysis
Statistical Analyses : Data was analyzed using statistical software. The model of Factorial in Completely Randomized Design 2*3 (factorial 2*3in CRD) was presented the particle sized of calcified seaweed and inclusion rate in the treatment diets serve as the fixed effect. All data was analyzed by two-way ANOVA (analysis of variance). The Duncan’s Multiple Range Test was used for determined the differences between the treatment means. The alphabetical notation was used to mark the differences at significant level of an α-level 0.05. All research was conducted at the Laboratory of Department of Aquaculture, Faculty of Fisheries, Kasetsart University, Bangkok, Thailand.
Results
The effect of calcified seaweed of LithoNutri Acqua and LithoNutri micron both 2 and 5Kg/ton supplementation on white shrimp (Litopenaeus vannamei) at low salinity condition on growth performance, digestibility, immunity, and accumulation of calcium and magnesium was studied. The results of growth performance were presented in Table 1. Shrimp fed LithoNutri Acqua and LithoNutri micron exhibited the better (p<0.05) growth performance and feed utilization. Survival rate of shrimp fed LithoNutri micron was higher than group of shrimp fed LithoNutri Acqua. Over all of production showed no significantly (p>0.05) between two calcified seaweed of LithoNutri Acqua and LithoNutri micron. The high level of LithoNutri Acqua 5 Kg/ton demonstrated the better survival rate than the low level of 2 Kg/ton whereas shrimp fed LithoNutri micron both 2 and 5 Kg/ton exhibited the highest (p<0.05) survival rate and showed no significantly different on the low and high dosage. Therefore, the LithoNutri micron both low and high dose demonstrated the efficacy on survival rate than LithoNutri Acqua.
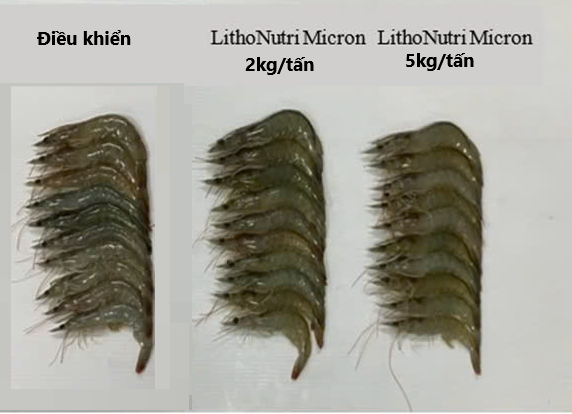
Table 1. Growth performance of white shrimp fed different calcified seaweed for 8 weeks under normal condition
|
Growth Performance |
Periods |
T1-
Control |
T2-
LNA2 |
T3-
LNA5 |
T4-
Control |
T5-
LNM2 |
T6-
LNM5 |
Products |
Levels |
Products*Levels |
| Production (g/Tanks) | 8wks | 271.7b | 303.3 a | 297.2 a | 271.7 b | 310.8 a | 303.0 a | 0.258 | <0.001 | 0.707 |
| Number of fish
(ind./tank) |
0wk |
30.00 |
30.00 |
30.00 |
30.00 |
30.00 |
30.00 |
….. |
….. |
….. |
| Weight (g/ind.) | 0wk | 2.03 | 2.04 | 2.05 | 2.03 | 2.03 | 2.05 | 0.904 | 0.615 | 0.985 |
| 2wks | 3.31 | 3.46 | 3.34 | 3.31 | 3.40 | 3.41 | 0.972 | 0.193 | 0.658 | |
| 4wks | 5.02 | 5.44 | 5.14 | 5.02 | 5.34 | 5.41 | 0.597 | 0.035 | 0.390 | |
| 6wks | 7.44 c | 7.96 a | 7.55 bc | 7.44 c | 7.86 ab | 7.85 ab | 0.524 | 0.002 | 0.240 | |
| 8wks | 10.66 b | 11.45 a | 10.81b | 10.66b | 11.25 ab | 11.24 ab | 0.641 | 0.005 | 0.271 | |
| Weight gain (g/ind.) | 2wks | 1.28 | 1.43 | 1.29 | 1.28 | 1.37 | 1.35 | 0.924 | 0.139 | 0.630 |
| 4wks | 3.00 | 3.40 | 3.09 | 3.00 | 3.31 | 3.36 | 0.573 | 0.037 | 0.390 | |
| 6wks | 5.42 c | 5.93 a | 5.50bc | 5.42 c | 5.83 ab | 5.80 ab | 0.477 | 0.001 | 0.208 |
| 8wks | 8.63 b | 9.41 a | 8.75b | 8.63 b | 9.22 ab | 9.18 ab | 0.622 | 0.005 | 0.265 | |
| Average daily gain | 2wks | 0.09 | 0.10 | 0.09 | 0.09 | 0.10 | 0.10 | 0.924 | 0.139 | 0.630 |
| (g/ind/d) | 4wks | 0.11 | 0.12 | 0.11 | 0.11 | 0.12 | 0.12 | 0.573 | 0.037 | 0.390 |
| 6wks | 0.13 c | 0.14 a | 0.13 bc | 0.13 c | 0.14 ab | 0.14 ab | 0.477 | 0.001 | 0.208 | |
| 8wks | 0.15 b | 0.17 a | 0.16 b | 0.15 b | 0.16 ab | 0.16 ab | 0.622 | 0.005 | 0.265 | |
| Specific growth rate | 2wks | 3.49 | 3.79 | 3.48 | 3.49 | 3.69 | 3.61 | 0.890 | 0.143 | 0.676 |
| (%/d) | 4wks | 3.24 | 3.50 | 3.27 | 3.24 | 3.45 | 3.46 | 0.542 | 0.058 | 0.435 |
| 6wks | 3.10 b | 3.24 a | 3.10 b | 3.10b | 3.23 a | 3.19 ab | 0.443 | 0.005 | 0.313 | |
| 8wks | 2.96 b | 3.08 a | 2.97 b | 2.96b | 3.06 ab | 3.03 ab | 0.604 | 0.015 | 0.410 | |
| Feed consumed | 2wks | 1.63 | 1.62 | 1.60 | 1.63 | 1.59 | 1.62 | 0.831 | 0.307 | 0.342 |
| (g/ind) | 4wks | 4.18 | 4.16 | 4.06 | 4.18 | 4.06 | 4.18 | 0.790 | 0.156 | 0.028 |
| 6wks | 7.58 a | 7.40 ab | 7.17 b | 7.58 a | 7.18 b | 7.35 ab | 0.835 | 0.001 | 0.087 | |
| 8wks | 12.06 a | 11.60 ab | 11.17 b | 12.06 a | 11.11b | 11.38 b | 0.518 | <0.001 | 0.131 | |
| Daily feed consumed | 2wks | 0.12 | 0.12 | 0.11 | 0.12 | 0.11 | 0.12 | 0.831 | 0.307 | 0.342 |
| (g/ind/d) | 4wks | 0.15 | 0.15 | 0.14 | 0.15 | 0.14 | 0.15 | 0.790 | 0.156 | 0.028 |
| 6wks | 0.18 a | 0.18 ab | 0.17 b | 0.18 a | 0.17 b | 0.18 ab | 0.835 | 0.001 | 0.087 | |
| 8wks | 0.22 a | 0.21 ab | 0.20 b | 0.22 a | 0.20 b | 0.20 b | 0.518 | <0.001 | 0.131 | |
| Feed conversion ratio | 2wks | 1.30 | 1.14 | 1.25 | 1.30 | 1.17 | 1.21 | 0.901 | 0.067 | 0.817 |
| 4wks | 1.40 | 1.24 | 1.33 | 1.40 | 1.24 | 1.25 | 0.606 | 0.021 | 0.708 | |
| 6wks | 1.40 a | 1.25b | 1.31b | 1.40 a | 1.24 b | 1.27 b | 0.415 | <0.001 | 0.798 | |
| 8wks | 1.40 a | 1.23b | 1.28 b | 1.40 a | 1.21 b | 1.24b | 0.290 | <0.001 | 0.736 | |
| Survival rate (%) | 2wks | 96.11 | 96.67 | 97.78 | 96.11 | 98.33 | 96.67 | 0.812 | 0.313 | 0.349 |
| 4wks | 93.33 | 93.89 | 96.11 | 93.33 | 96.11 | 93.33 | 0.798 | 0.144 | 0.027 | |
| 6wks | 88.89 b | 91.11 ab | 93.89 a | 88.89 b | 93.89 a | 91.67 ab | 0.836 | 0.002 | 0.087 | |
| 8wks | 85.00 b | 88.33 ab | 91.67 a | 85.00 b | 92.22 a | 90.00 a | 0.490 | <0.001 | 0.107 |
Note: a, b, c means values with different superscript letters in row show significant differences (p< 0.05
The immunity of white shrimp fed different calcified seaweed for 8 weeks was presented in Table
- The results showed that after 14 days of feeding trials, white shrimp fed diets supplemental calcified seaweed of LithoNutri Acqua or LithoNutri micron both at 2 and 5Kg/ton had significantly higher lysozyme activity and superoxide dismutase activity than control group (p<0.05) whereas glutathione was not significantly differences (p>0.05). In addition, lysozyme activity of shrimp fed diets supplemental calcified seaweed of LithoNutri Acqua demonstrated the better performance than shrimp fed diets supplemental calcified seaweed of LithoNutri micron (p<0.05).
Focusing on continuous feeding to 8 weeks, the immunity in normal condition showed that haemocyte count, hemolymph protein, lysozyme activity, superoxide dismutase activity and glutathione of white shrimp fed diets supplemental calcified seaweed of LithoNutri Acqua and LithoNutri micron both 2 and 5Kg/ton were higher (p<0.05) than control group. The haemocyte count and lysozyme activity of shrimp fed LithoNutri Acqua exhibited the higher ability to protect themselves from pathogen infection than LithoNutri micron. On the other hand, hemolymph protein, and superoxide dismutase activity of shrimp fed LithoNutri micron exhibited the higher ability to utilize nutrient especially protein and ability to reduce free radicals to protect themselves from pathogen infection than LithoNutri Acqua. Furthermore, phenoloxidase activity was not significantly differences (p>0.05). Hence, under normal condition both of shrimp fed diets supplemental calcified seaweed of LithoNutri Acqua and LithoNutri micron at 2 and 5Kg/ton had
ability to utilize nutrient and ability to reduce free radicals to protect themselves from pathogen infection via different process and different parameters
Table 2. Immunity of white shrimp fed different calcified seaweed for 8 weeks under normal condition
|
Immunity |
Periods |
T1-
Control |
T2-
LNA2 |
T3-
LNA5 |
T4-
Control |
T5-
LNM2 |
T6-
LNM5 |
Products |
Levels |
Products
*Levels |
| Antioxidative stress enzyme activity | ||||||||||
| Lysozyme(unit/ml) | 14days | 153.33 c | 210.00 a | 213.33 a | 153.33 c | 193.33 ab | 180.00 b | 0.020 | <0.001 | 0.131 |
| SOD(U/ml) | 14days | 1.69b | 2.75 a | 2.55 a | 1.69 b | 2.70 a | 2.45 a | 0.689 | <0.001 | 0.949 |
| Glutathione(nmole/ml) | 14days | 32.00 | 32.72 | 32.42 | 32.00 | 32.35 | 32.58 | 0.753 | 0.114 | 0.580 |
| Shrimp immunity | ||||||||||
| Haemocyte count
(X105 cell/ml) |
8wks |
37.50c |
59.00 a |
45.33b |
37.50c |
43.50 b |
44.17 b |
0.001 |
<0.001 |
<0.001 |
| Hemolymph Protein
(g/dL) |
8wks |
3.59c |
4.81 b |
4.75 b |
3.59 c |
5.05 a |
5.05 a |
0.001 |
<0.001 |
0.052 |
| Phenoloxidase activity
(unit/min/mg Proteine) |
8wks |
85.09 |
89.72 |
89.93 |
85.09 |
92.51 |
92.51 |
0.379 |
0.027 |
0.820 |
| Lysozyme(unit/ml) | 8wks | 160.00 b | 203.33 ab | 226.67 a | 160.00b | 183.33 ab | 203.33 ab | 0.292 | 0.016 | 0.740 |
| SOD(U/ml) | 8wks | 3.13 b | 3.46 ab | 3.53 ab | 3.13 b | 3.41 ab | 3.56 a | 0.980 | 0.015 | 0.942 |
| Glutathione(nmole/ml) | 8wks | 32.02 | 32.22 | 32.18 | 32.02 | 32.53 | 32.23 | 0.335 | 0.094 | 0.533 |
Note: a, b, c means values with different superscript letters in row show significant differences (p< 0.05)
The digestive enzyme activity which is the parameter related to the efficacy and amount of mineral in the diet to be cofactor of digestive enzyme activity and absorbed to use for shrimp metabolism resulting on shrimp growth performance and health. The digestive enzyme activity of white shrimp fed different calcified seaweed for 8 weeks under normal condition was presented in Table
- Shrimp fed diets supplemental calcified seaweed of LithoNutri Acqua and LithoNutri micron both at 2 and 5Kg/ton demonstrated the efficacy to enhance digestive enzyme activity especially amylase (p<0.05), whereas lipase and protease were not significantly differences (p>0.05). These can imply that calcified seaweed had ability to promote starch digestion to get more energy for improve shrimp growth performance.
Table 3. Digestive enzyme activity of white shrimp fed different calcified seaweed for 8 weeks under normal condition
|
Growth Performance |
Periods |
T1-
Control |
T2-
LNA2 |
T3-
LNA5 |
T4-
Control |
T5-
LNM2 |
T6-
LNM5 |
Products |
Levels |
Products
*Levels |
| Amylase(unit/g tissue) | 8wks | 128.41c | 139.75 bc | 164.34 ab | 128.41 c | 196.01 a | 152.47 bc | 0.109 | 0.007 | 0.015 |
| Lipase(unit/g tissue) | 8wks | 16.35 | 19.35 | 19.11 | 16.35 | 20.90 | 21.46 | 0.335 | 0.149 | 0.757 |
| Protease(unit/g tissue) | 8wks | 65.65 | 68.89 | 70.60 | 65.65 | 71.31 | 71.81 | 0.593 | 0.136 | 0.905 |
Note: a, b, c means values with different superscript letters in row show significant differences (p< 0.05)
The nutrient digestibility of diets supplemental calcified seaweed of LithoNutri Acqua and LithoNutri micron in white shrimp was exhibited in Table 4. There were significantly differences on digestibility coefficient, protein, lipid, ash, calcium, phosphorus, and energy digestibility. The diets supplemental calcified seaweed of LithoNutri micron presented the higher protein, ash, and calcium digestibility than diet of LithoNutri Acqua (p<0.05). In addition, LithoNutri micron at 2 Kg/ton demonstrated the efficacy to enhance all nutrient digestibility better than LithoNutri Acqua (p<0.05). Moreover, the diets supplemental calcified seaweed of LithoNutri Acqua 5Kg/ton exhibited the better nutrient digestibility than diet of LithoNutri Acqua 2Kg/ton and LithoNutri micron 25Kg/ton. The high nutrient digestibility provided more nutrients to absorb and utilize for promote growth performance and immunity.
Table 4. Nutrient digestibility of diets supplemental calcified seaweed in white shrimp
|
Growth Performance |
Periods |
T1-
Control |
T2-
LNA2 |
T3-
LNA5 |
T4-
Control |
T5-
LNM2 |
T6-
LNM5 |
Products |
Levels |
Products
*Levels |
| Digestibility
coefficient(%) |
8wks |
54.76c |
62.03 a |
62.60 a |
54.76 c |
63.14 a |
60.75 b |
0.420 |
<0.001 |
0.005 |
| Protein Digestibility(%) | 8wks | 70.03 d | 74.74 b | 75.14 ab | 70.03 d | 75.27 a | 72.77 c | <0.001 | <0.001 | <0.001 |
| Lipid Digestibility(%) | 8wks | 96.10 e | 97.58 c | 98.36 b | 96.10 e | 98.66 a | 97.25 d | 0.840 | <0.001 | <0.001 |
| Ash Digestibility(%) | 8wks | 4.16 ac | 12.58 a | 14.24 a | 4.16 c | 12.61 a | 8.61 b | 0.014 | <0.001 | 0.005 |
| Calcium
Digestibility(%) |
8wks |
17.78 e |
22.14 d |
27.91 b |
17.78 e |
31.09 a |
24.69 c |
<0.001 |
<0.001 |
<0.001 |
| Phosphorus
Digestibility(%) |
8wks |
9.75d |
19.21 bc |
22.57 ab |
9.75 d |
25.30 a |
17.37 c |
0.755 |
<0.001 |
0.001 |
| Energy Digestibility(%) | 8wks | 69.55 c | 78.60 b | 79.53 ab | 69.55 c | 80.20 a | 78.57 b | 0.438 | <0.001 | 0.006 |
Note: a, b, c means values with different superscript letters in row show significant differences (p< 0.05)
The nutrient composition and mineral accumulation in whole shrimp body of white shrimp fed different calcified seaweed for 8 weeks under normal condition were presented in Table 5. The moisture and lipid accumulation in shrimp fed LithoNutri Acqua 2 and 5 Kg/ton were higher than group of shrimp fed LithoNutri micron 2 and 5 Kg/ton (p<0.05). The protein and mineral accumulation in term of ash in shrimp fed LithoNutri micron 2 and 5 Kg/ton were higher than group of shrimp fed LithoNutri Acqua 2 and 5 Kg/ton (p<0.05). Calcium and Magnesium accumulation in whole shrimp body of white shrimp fed LithoNutri micron 2 Kg/ton were highest follow by group of shrimp fed LithoNutri micron 5 Kg/ton (p<0.05) whereas group of shrimp fed LithoNutri Acqua 2 and 5 Kg/ton demonstrate the lower accumulation (p<0.05). Focusing on phosphorus accumulation in shrimp fed LithoNutri Acqua and shrimp fed LithoNutri micron, there were not significantly different (p>0.005) on phosphorus accumulation whereas the low level of calcified seaweed both LithoNutri Acqua 2 Kg/ton and LithoNutri micron 2 Kg/ton supplemental in shrimp diet exhibited the high phosphorus accumulation in whole shrimp body.
These indicated the better efficacy of LithoNutri micron on shrimp utilization and accumulation and the low level of both calcified seaweed 2 Kg/ton demonstrated the better accumulation than the high level of 5 Kg/ton.
Table 5. Nutrient composition and mineral accumulation of white shrimp fed different calcified seaweed for 8 weeks under normal condition
|
Growth Performance |
Periods |
T1-
Control |
T2-
LNA2 |
T3-
LNA5 |
T4-
Control |
T5-
LNM2 |
T6-
LNM5 |
Products |
Levels |
Products
*Levels |
| Moisture(%) | 8wks | 76.75 b | 75.87d | 77.28 a | 76.75 b | 75.59 e | 76.08 c | <0.001 | <0.001 | <0.001 |
| Protein(%) | 8wks | 15.67 d | 16.51 b | 15.88 c | 15.67d | 17.29 a | 16.53 b | <0.001 | <0.001 | <0.001 |
| Lipid(%) | 8wks | 0.47 b | 0.51 a | 0.41 d | 0.47 b | 0.45 c | 0.46 bc | 0.438 | <0.001 | <0.001 |
| Fiber(%) | 8wks | 1.45 ab | 1.32 d | 1.41 bc | 1.45 ab | 1.49 a | 1.37 c | 0.006 | 0.009 | <0.001 |
| Ash(%) | 8wks | 3.45 d | 3.40 e | 3.54 c | 3.45 d | 3.59 b | 3.64 a | <0.001 | <0.001 | <0.001 |
| Calcium accumulation
(%) |
8wks |
0.51 d |
0.53 c |
0.55 c |
0.51 d |
0.71 a |
0.66 b |
<0.001 |
<0.001 |
<0.001 |
| Magnesium
accumulation (%) |
8wks |
0.07d |
0.07 c |
0.07 c |
0.07 d |
0.08 a |
0.08 b |
<0.001 |
<0.001 |
<0.001 |
| Phosphorus
accumulation (%) |
8wks |
0.32 b |
0.35 a |
0.32 b |
0.32 b |
0.35 a |
0.33 b |
0.140 |
<0.001 |
0.308 |
Note: a, b, c means values with different superscript letters in row show significant differences (p< 0.05)
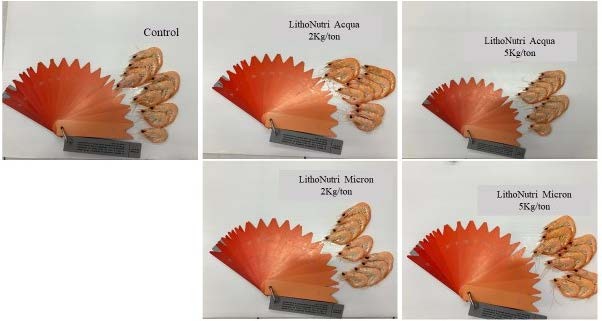
The color of shrimp after boiled exhibited the high redness and yellowness in both group of shrimp fed calcified seaweed of LithoNutri Acqua and LithoNutri micron at 2 and 5Kg/ton was presented in Table 6. The lightness was in the same range (p>0.05). Moreover, the redness and yellowness in groups of shrimp fed diet supplemental LithoNutri Acqua and LithoNutri micron at 2 and 5Kg/ton were higher than control group. This indicated the efficacy of LithoNutri Acqua and LithoNutri micron on enhance the red color in shrimp due to mineral in the calcified seaweed has wild composition and high digestibility, high utilization especially to reduces stress then protect carotenoids to express the red color which can determined from the redness and yellow.
Table 6. Cooked shrimp color after fed different calcified seaweed for 8 weeks under normal condition
|
Cooked shrimp color |
Periods |
T1-
Control |
T2-
LNA2 |
T3-
LNA5 |
T4-
Control |
T5-
LNM2 |
T6-
LNM5 |
Products |
Levels |
Products*Levels |
| Lightness | 8wks | 65.13 | 64.23 | 65.57 | 65.13 | 65.43 | 65.37 | 0.562 | 0.660 | 0.560 |
| Redness | 8wks | 8.48b | 10.09 a | 10.26 a | 8.48b | 10.08 a | 10.05 a | 0.857 | 0.002 | 0.969 |
| Yellowness | 8wks | 16.05b | 17.75 a | 18.14 a | 16.05b | 17.84 a | 17.82 a | 0.827 | <0.001 | 0.881 |
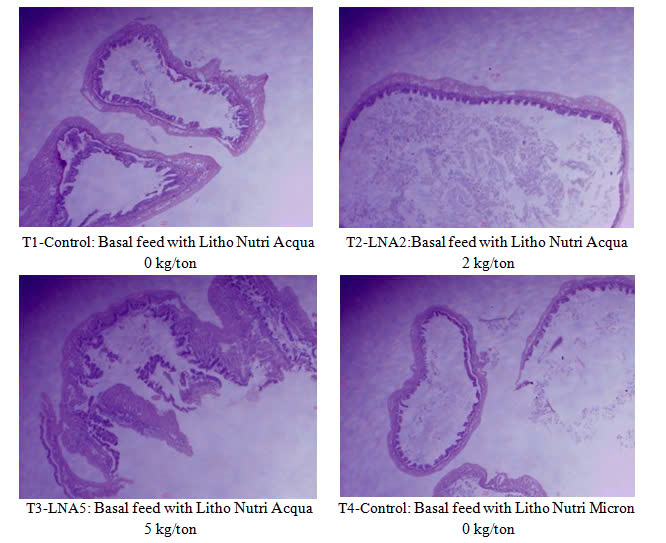
Histological of hepatopancreas and intestine
In crustaceans, the hepatopancreas is used for monitoring health and served as a sensitive indicator for digestion, metabolism, ecdysis, nutritional status, and diseases resistance in various shrimp species. It is the site of digestion, nutrient absorption, reserve storage, synthesis, and secretion of digestive enzymes. Histological analysis of the hepatopancreas has been used as a practical means for assessing the nutritional condition in the shrimp culture. It is composed of numerous blind end tubules, with each tubule consisting of different epithelial cell types, i.e. E-cell (embryonic), R- cell (resorptive), F-cell (fibrillar), and B-cell (blisterlike). The R-cells in hepatopancreas epithelia are known to have the function of being the main site for lipid storage, and they can be used to monitor the nutritional condition in crustaceans. B-cells are considered to have the function of being the main site for synthesis of digestive enzymes and antioxidant enzymes accelerate the mobilization of nutrients in hepatopancreas. The F-cells are responsible for protein synthesis and storage of minerals. The E-cells found at the distal tips of each tubule with proximal nuclei and conspicuous nuclear bodies which give rise to the other three cell types of the digestive gland.
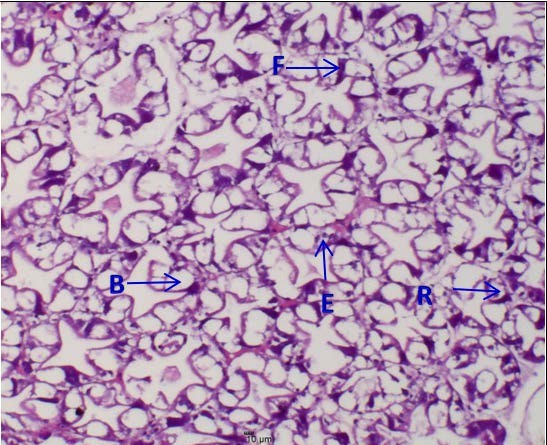
The Light micrograph from hepatopancrease of white shrimp fed different levels of calcified seaweed of LithoNutri Acqua and LithoNutri micron for 8 weeks under normal condition was presented in Figure 1. The B-cell in hepatopancrease of shrimp fed LithoNutri Acqua 5Kg/ton and LithoNutri micron 2 and 5Kg/ton in T3-LNA5, T5-LNM2 and T6- LNM5 were larger than group of shrimps fed T1-Control, T2-LNA2 and T4-Control diet. These indicated the ability to synthesis digestive enzyme for enhance nutrient digestibility to promote growth performance and demonstrated the ability to produce antioxidative stress enzymes to accelerate the mobilization of immune substances. Moreover, the R-cell for lipid accumulation was shown in all treatments.
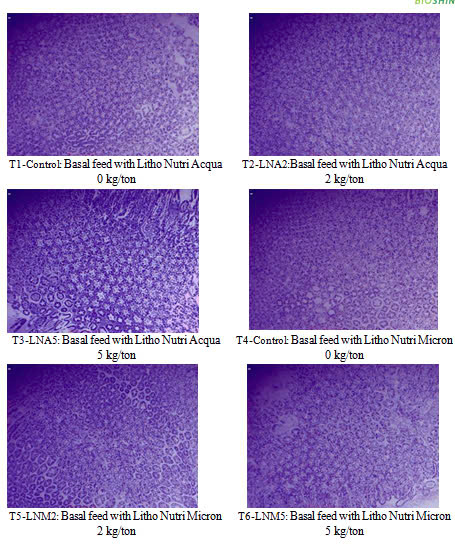
Figure 1 Light micrograph of hepatopancrease from white shrimp fed different levels of calcified seaweed of LithoNutri Acqua and LithoNutri micron for 8 weeks under normal condition; scale bar= 40 µm, x100).
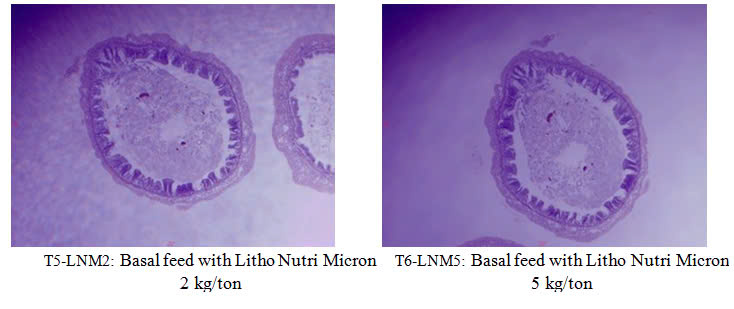
The light micrograph from intestine of white shrimp fed different levels of calcified seaweed of LithoNutri Acqua and LithoNutri micron for 8 weeks under normal condition was presented in Figure 2. The change in epithelial structure and seperation from basement membrane were found in all groups. The intestinal villi presented the long villi and had more fold in group of shrimp fed LithoNutri Acqua 2 and 5Kg/ton and LithoNutri micron 2 and 5Kg/ton in T2-LNA2, T3- LNA5, T5-LNM2 and T6- LNM5 than T1-Control, and T4-Control diet.
immune substances. Moreover, the R-cell for lipid accumulation was shown in all treatments.
Conclusion
The effect of calcified seaweed supplementation on white shrimp (Litopenaeus vannamei) at low salinity condition of 5 ppt on growth performance, digestibility, immunity, and accumulation of calcium and magnesium accumulation showed that LithoNutri Acqua and LithoNutri micron at inclusion rate 2 and 5Kg/ton in the diet could promote the shrimp growth performance, feed utilization in term of average daily gain, specific growth rate, feed conversion ratio and shrimp production (p<0.05) including survival rate. Moreover, supplemental that LithoNutri Acqua at 2- 5 Kg/ton and LithoNutri micron at inclusion rate 2 and 5Kg/ton in shrimp diet was recommended for improve immunity, digestive enzyme activity nutrient digestibility, and the redness of cooked shrimp color. Furthermore comparing between two calcified seaweed on over all of performance, and survival rate, supplemental LithoNutri micron 2-5 Kg/ton in shrimp diet exhibited a little bit better overall performance than LithoNutri Acqua 2-5 Kg/ton and recommend to supplement calcified seaweed not more than 5 Kg/ton for better performance.
——————————————————-
All research was conducted at the Laboratory of Department of Aquaculture, Faculty of Fisheries, Kasetsart University, Bangkok, Thailand.