There is one real measure of success in shrimp and fish farming much as there is with any other agricultural activity. The value of the crop at harvest minus the cost of producing the crop is the profit for the farmer. As with any business, profits are what sustain it. Shrimp farming, as a whole, is a slowly maturing multinational agrisector prone to fluctuations in output largely as a result of biosecurity lapses. Diseases are the bane of shrimp farmers globally. Their impacts vary from country to country, farm to farm and pond to pond. The scope of these diseases and their impact is addressed elsewhere. This article summarizes what farmers should be monitoring in their animals and focuses on one element of the population, the coefficient of variation (CV) of the animal weights
Enlightened farmers sample their animals regularly to look for overt animal health issues and to judge how the population is performing. These should be representative samples skewed towards finding shrimp that are not necessarily typical of the population as a whole. These outliers can tell a farmer a number of very important things. They are an important element of a proactive strategy intended to minimize the impact of potential problems as contrasted with a reactive strategy which deals with problems once they are present. A simple analogy helps put these terms into perspective. An example of a proactive strategy would be one to prevent a problem from entering into your production environment by exclusion. This can be done by ensuring that the animals that are stocked are free of any obligate pathogens as well as by carefully observation of animal behavior and appearance. Having access to the tools to prevent a problem from occurring in the first place is an example of being proactive. Applying this to shrimp farming, a proactive strategy would be to ensure that no known viruses and other obligate pathogens enter the system through the PLs. Only by regularly screening the animals can the farmer be sure that these have not entered the system via some other route.
Important parameters that farmers need to be routinely screening for are the outward appearance of the animals (including but not limited to pigmentation, lesions, fouling of gills and external surfaces, discoloration, muscle discoloration, necrosis, and melanin deposition, etc.) and growth rates (weights) as well as the presence of feed or other materials in the gut. As with shrimp diseases, the scope of these are addressed elsewhere. Trained personnel can look at tissue smears and make judgements about the relative health of important features of the hepatopancreas and other organs. Ideally, this should be done hand in hand with determining water quality parameters including but not limited to pH, salinity, temperature (at surface and deepest point in pond), total accumulated organic matter, ammonia/ammonium levels, nitrate, and nitrate levels. At least annually in older ponds heavy metal and P levels need to be determined. If your farm is in an area where exposure to pesticides can occur these should be tested for as well.
The purpose of this testing is to get a snapshot of what is happening in the population at the moment of sampling and compare this with your weekly or biweekly samples. As there is no set frequency that is standard, the frequency should depend on the pond history, the source of the PLs, the perception of the management regarding feeding activity and visual observation of shrimp behavior. Routine PCR testing is out of reach cost wise for most farms although larger operations can justify the cost. For groups that do not have this ability, consider the testing that Genics Pty. Ltd. (https://www.genics.com.au) is offering. If you take a population sample that is random this is fine for getting some idea of the relative frequency of potential problems but useless if small numbers of animals are affected. If a problem is present at a very low level, what is important is how these levels change over the course of the cycle.
One parameter that is very useful and thus important are the weights of the animals. The coefficient of variation (CV) is a simple statistical tool that measures the amount of variation among a population. The weights are put into an equation and the value generated tells you what the percentage variation of the weight is for the entire population. This should be generated while the crop is growing and at harvest when a final number is generated.
At harvest the appearance of the animals impacts their value. The appearance can also tell us something about what is going on in the population. If the shrimp are heavily fouled with signs of gill abnormalities, there could be too much accumulated organic matter where the shrimp are. If they have red tails, they are stressed in some manner. If they have white spots on them, they could have the virus WSSV. Most shrimp farmers understand that when there is a great deal of variability among the weights of animals at harvest that this is indicative of something being amiss and that this value can impact the profitability of a crop.
Ideally CVs should be low. The lower they are in general, the healthier the animals are. This can be taken to mean that your shrimp are doing well. They have adequate access to feed such that even the smaller shrimp can get what they need. They have no overt disease issues although there are some pathogens that can be present that do not show symptoms until the later stages of the infections. EHP is one example. The spore loads need to build in the animals to the point where their appetites are impacted.
The higher the CVs are, again in general, the less healthy the population is. Many things can cause this. They range from malnutrition, inadequate feed availability to chronic (IHHNV) and acute diseases (vibriosis among many others). As the crop gains weight if you see this number go really high with no signs of it leveling off after returning to a lower level, you have a problem that could cost you the profit of your crop.
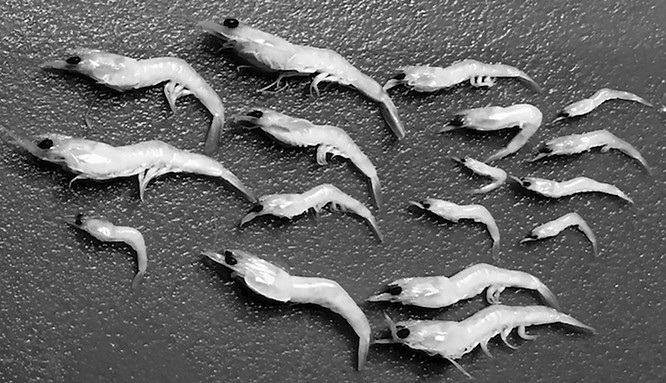
Another way to look at this is the presence of different size classes. How many different size classes are there in the final crop? Typically, if you have three or less you are doing OK. If you have five or more than something is going on. The more variation among the population the lower potential value of the crop. The photo below shows a sample with a very high degree of size variation. Invariably this is a result of some disease processes occurring in the population.

Photo 1. Very high CVs in a sampled population.
Odds are that this variability would have been apparent from the very onset and as the cycle progresses the differences became even larger. If the larger animals are healthy and marketable, the smaller animals are often not.
Shrimp farming is challenging at best. Farmers are being assailed by companies selling magic bullets, quick fixes for problems that benefit the company selling them more so than the farmer. They cannot trust that the PL vendors are offering them animals that are truly clean and free of known pathogens and that are produced in a manner that minimizes the possibilities of as of yet uncharacterized pathogens being present. Regulatory oversight can be helpful but can also be highly variable. Disease is a natural process that interferes with consistency and ultimately profitability. Closely observing how the animals are changing over time is useful for finding the best long term strategies to minimize any negative impacts. Determining the CV during and at the end of the production cycle is one of the more valuable tools.
This article will appear in Panorama Acuicola Magazine


